100 +
STUDENTS' TRAINED
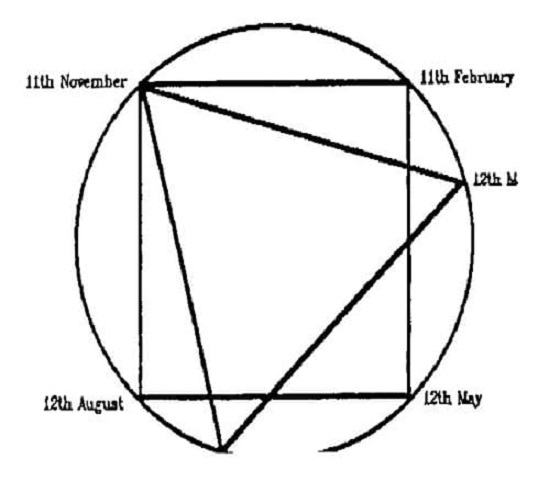
W.D. Gann created trading strategies using geometry, astrology, and ancient mathematics.
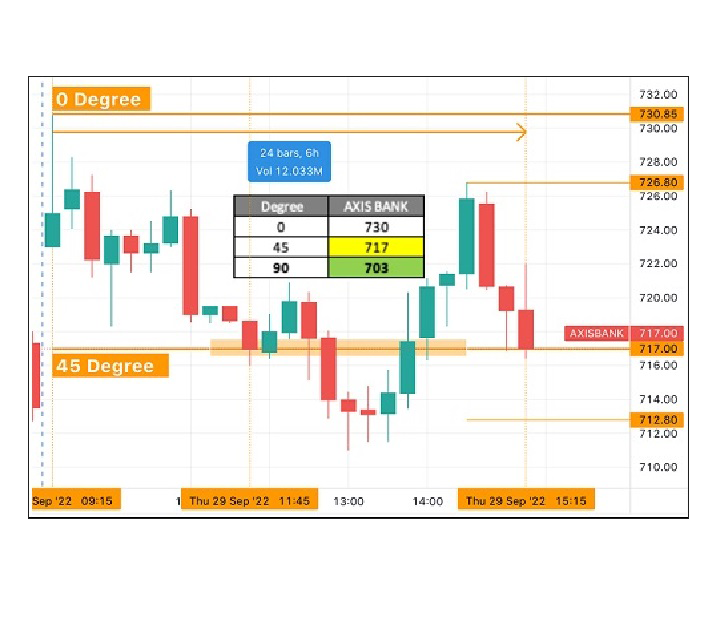
Gann indicators, are used in predicting the top, bottom, and future price moves of commodities.
Gann made 286 transactions in various stocks, on both the long and short side of the market of which 264 of these transactions resulted in profits.

Support is the level at which demand is strong enough to stop the stock from falling.
Resistance is the level at which supply is strong enough to stop the stock from moving higher.
Gann's legacy and trading strategies and Gann indicators, using geometry, astrology, and ancient mathematics, continue to influence investors.
Next Monthly Batch starts on
2nd February 2023,
Monday to Friday,
40 Minutes Live Session on Zoom.
20 Sessions / 4 Weeks / 1 Month
Timing - 9:00 - 9:40 PM
Recorded Sessions will be provided
as mentioned in the course details.
Ask Your Doubts Anytime,
Between 9:00 AM to 9:00 PM
Personal Attention will be provided.
Next Monthly Batch starts on
2nd February 2023,
Monday to Friday,
40 Minutes Live Session on Zoom.
20 Sessions / 4 Weeks / 1 Month
Timing - 9:00 - 9:40 PM
Recorded Sessions will be provided
as mentioned in the course details.
Get Instant Webinar Recorded Sessions
Can Watch at Your Ease
Don't Have to Wait For the Monthly Batch
Approx 40 Minutes Each Video
Approx 20 Videos
Ask Your Doubts Anytime,
Between 9:00 AM to 9:00 PM


Nifty / Bank Nifty / Stocks / Dow Jones / Bitcoin / Commodities"


STUDENTS' TRAINED
YOUTUBE SUBCRIBERS
TELEGRAM SUBSCRIBERS
HOURS OF VIDEO CONTENT

We believe that WD Gann was one of the greatest trader of his Time and even today, Traders would like to follow WD Gann's Trading Techniques to make money in the Stock Market.


"We understand, WD Gann trading techniques, we have traded those techniques, prepared video's and also are teaching our Students to trade on the basis of these Techniques. The ultimate aim is to understand the Market Cycles and make consistent Profits"

"Aur Main aim, to make you understand
1. The Cycles in the Markets,
2. Get a correct Entry
3. Exit at appropriate Point
4. Consistent Profits is what we look for, however small they maybe."

We believe that at the very bottom of your Trading, should be a TOOL which can measure your trade movement, hence we found out a UNIT, which defines your measurement of Trading.

Market moves in cycles and it is important to identify these cycles in various Time Frames. We, at Unit of Technical Analysis have developed an expertise to understand and interpret the cycles and also to trade them.

"In cycles there must be a lesser, a greater and intermediate cycle,
Or Cycles within Cycles.
Or Wheel within a Wheel.”
- TTTA, pg. 78, Chapter VII - WD Gann